
Reading a loudspeaker datasheet
Driver datasheets contain the electrical, mechanical and acoustic parameters needed for enclosure design. The important skill is understanding which numbers describe which limitation.
Start with the question, not the biggest number
A datasheet supports selection and modelling; it does not tell the entire story of a finished loudspeaker. A compact sealed box, a two-way speaker and a high-output subwoofer need different properties. Read the measurement conditions alongside each number: voltage, distance, frequency range, baffle and smoothing can all change the apparent comparison.
Nominal impedance and DC resistance
Nominal impedance is a classification rather than a constant resistance. Re is the voice-coil DC resistance and is commonly lower. The impedance curve varies with frequency, especially around mechanical resonance and at higher frequencies where inductance matters. Amplifier loading and passive crossover behaviour depend on this real curve, not only the number printed beside the terminals.
Fs, Q and Vas work together
Fs is the driver’s free-air resonance, not a guaranteed bass limit. Qms describes mechanical damping, Qes electrical damping and Qts their combined effect. Vas expresses suspension compliance as an equivalent air volume; it is not a required cabinet volume. These parameters should be used together in an appropriate model rather than as isolated quality rankings.
Area and excursion set displacement
Sd is effective radiating area, not simply a circle calculated from frame diameter. Xmax describes linear excursion according to the manufacturer’s definition. Distinguish one-way excursion, peak-to-peak travel and mechanical clearance. Their product gives a useful displacement-volume estimate, but says nothing by itself about thermal limits or the frequency response.
Power ratings need test conditions
Continuous, programme and peak ratings can use different conventions. A thermal power rating does not guarantee that low-frequency excursion stays safe in every cabinet. Nor does a more powerful amplifier automatically force its maximum power into a driver. Check the actual signal, gain, filters, impedance and mechanical operating range.
Sensitivity is not maximum output
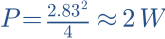
A 2.83 V sensitivity figure is approximately a 1 W reference only into 8 Ω. Into a resistive 4 Ω load it is about 2 W. Compare matching references and relevant frequency ranges. A high average midband sensitivity does not establish strong output at 30 Hz. Response curves and measurements at several angles provide additional information.
Know where the simple model ends
Le and BL describe useful aspects of inductance and motor strength, but real drivers are not perfectly linear or frequency independent. Small-signal Thiele–Small models do not predict every high-level effect, breakup mode or baffle interaction. Check physical dimensions and manufacturer tolerances, simulate the intended enclosure and verify the prototype with measurements.
Work it out · answers unfold
Write down your prediction first, then your calculation. Open the answer only when you are ready to compare.
01 · A woofer gives 88 dB and a tweeter 92 dB at the same operating point and reference. What level correction is an initial estimate?
Show worked answer
- Difference: 92 - 88 = 4 dB.
- Initially attenuate tweeter by 4 dB.
- Then measure crossover region.

02 · A 4 Ω driver is measured at 2.83 V. What is electrical power for a purely resistive substitute?
Show worked answer
- P = U²/R.
- 2.83²/4 = 2.002 W.
- Here 2.83 V means about 2 W, not 1 W.
03 · How do you ideally convert 90 dB at 2.83 V/1 m with 4 Ω to 1 W/1 m?
Show worked answer
- Initial power is about 2 W.
- Half power reduces level by 3.01 dB.
- Result about 87 dB/1 W/1 m.

19 · Why must separately measured driver phases not be arbitrarily reset to zero when predicting their sum?
Show worked answer
- Relative timing determines phase difference.
- Independent shifts remove real delay differences.
- Use a shared time reference or correctly restore known offsets.